DNA Evidence: What the Match Can and Cannot Support
DNA has the strongest reputation in forensic science and, often, the narrowest honest claim. A match tells you whose DNA a profile is, not how or when it got there. Eight sections examine where the reputation outruns the science: mixtures and the number of contributors, the probabilistic-genotyping software and its sealed source code, how the same profile yields different answers, the match statistic and the far larger error rate behind it, innocent transfer, contamination and the cases that got it wrong, and how to word a conclusion so it carries only what the evidence supports.
What the match actually says
DNA carries a reputation no other forensic discipline enjoys: the gold standard, the test that cannot be wrong. Part of that reputation is earned. For a complete profile from a good single-source sample, comparison is objective and the random-match probability is genuinely astronomically small. The President's Council of Advisors on Science and Technology, reviewing the field in 2016, found single-source and simple two-person mixtures foundationally valid. That is the strong core, and an honest witness does not give it away.
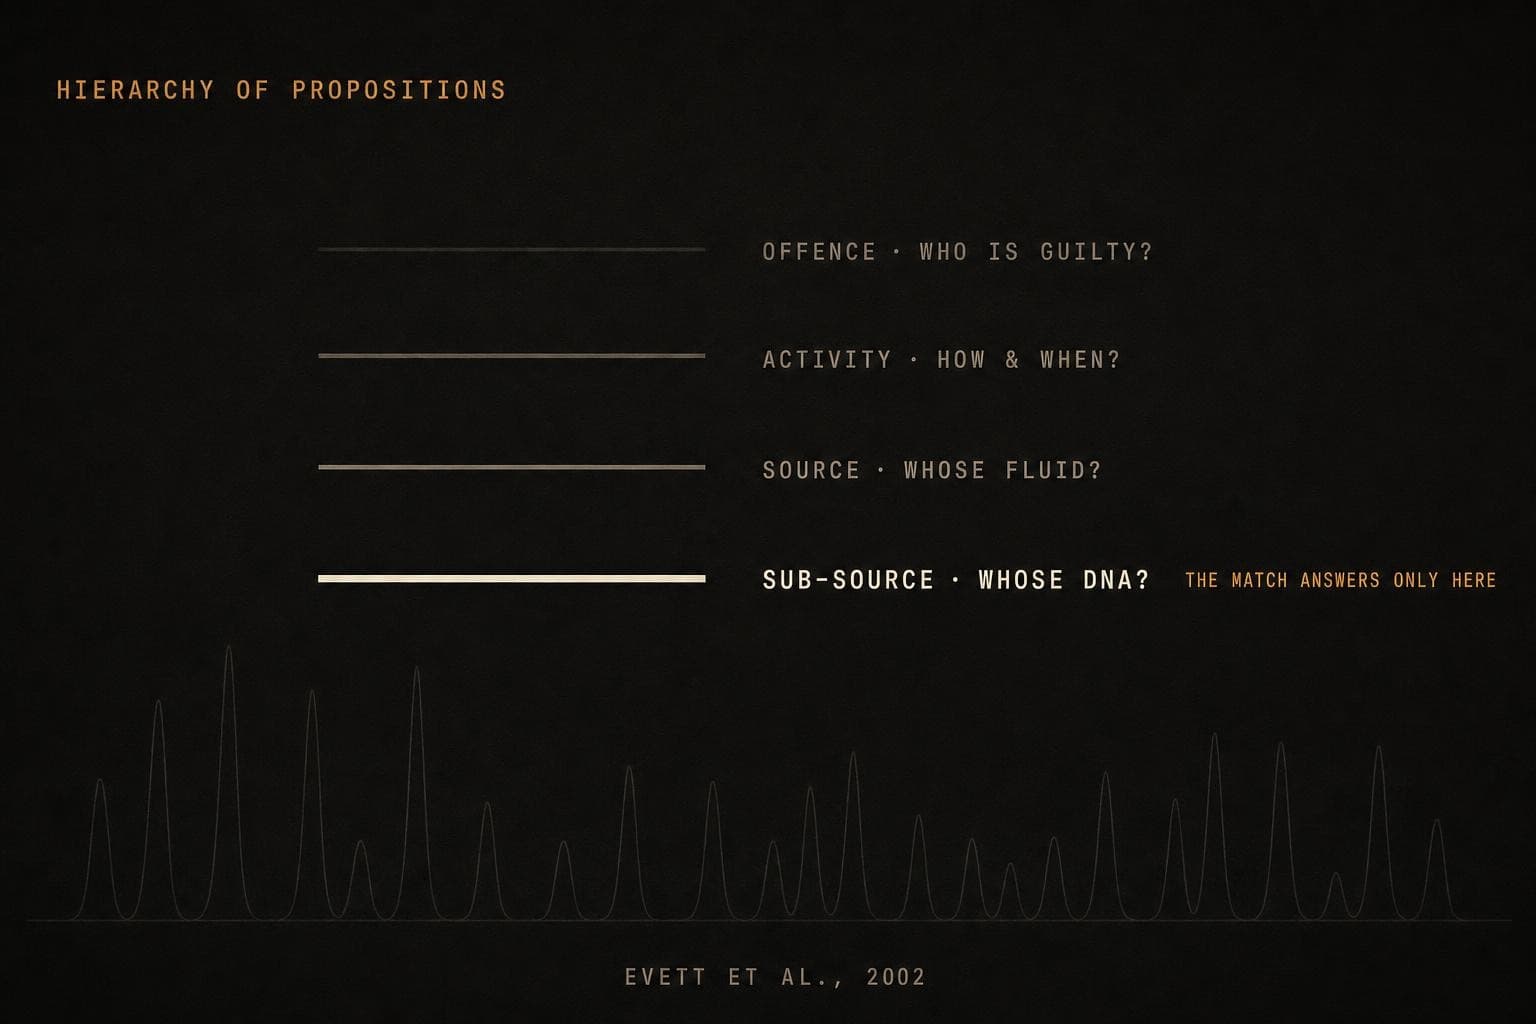
The difficulty is what the strength attaches to. Forensic scientists work with a hierarchy of propositions: sub-source (whose DNA is this?), source (what body fluid or tissue is it, and whose?), activity (how and when did it get there?), and offence (did this person commit the crime?). A random-match statistic answers only the bottom rung. It is a statement about the origin of a profile, not about an act.
The gap between the rungs is not rhetorical; it is measurable. Ian Evett and colleagues, in the paper that formalised the hierarchy, worked a case in which the sub-source match was treated as effectively certain, and the likelihood ratio at the activity level, the question the jury actually had to decide, came out of the order of a thousand, still substantial but orders of magnitude short of the effectively certain sub-source match. Same evidence, a very different number as you climb from "whose DNA" to "who did it." Graham Jackson and Alex Biedermann make the same point on a strangulation case: a billion-to-one profile can be worth a likelihood ratio near one for the activity in dispute, because the question of how the DNA arrived is a different question from whose it is.
And the reputation outruns the science fastest at the low end. Below the stochastic threshold, roughly 100 to 200 picograms, the DNA of only 15 to 30 cells, results are not reproducible. As Bruce Budowle and colleagues put it, low-template typing does not yield the same result if the sample is analysed twice, so it cannot be considered robust. A profile that will not repeat cannot bear the weight of a match.
“whereas the inference in relation to the source of the DNA in a crime sample might be overwhelmingly strong, the inference in relation to the propositions that a jury must consider relating to the identity of the actual offender may be much more tentative.”
So the honest frame for the whole discipline is this. DNA is often the strongest single piece of evidence in a case, and the sub-source claim, whose profile this is, deserves the confidence it usually gets. But that confidence belongs to one rung of a ladder, and it does not transfer upward on its own. The examiner who lets an overwhelming sub-source match be heard as proof of what the defendant did, or who offers a confident profile from a few picograms of degraded, mixed material, has climbed past what the evidence supports. The sections that follow are the places where that climb happens: counting contributors, the software, the reproducibility, the statistic, the transfer, the contamination, and the wording.
Whose, not how
You have told the jury the DNA on the weapon matches the accused.
"I put it to you that your match probability answers one question and one question only, whose DNA this profile is, and that it tells this jury nothing about how, or when, that DNA came to be on the knife. That is right, isn't it?"
Mixtures and the number of contributors
Real casework is not a clean reference swab. A large share of crime samples are mixtures of two or more people, and the first hard question is the most basic: how many contributed? Often the honest answer is that you cannot be sure. The common counting method, taking the locus with the most alleles and dividing, systematically undercounts. Hinda Haned and colleagues showed that for five-person mixtures this maximum-allele-count method is wrong the overwhelming majority of the time, correct in as few as 2 to 5% of cases even with a full set of markers. The method can only miss people; it cannot over-count.
The more capable tools do better but hit a floor. Testing the probabilistic method NOCIt against the alternatives, Lauren Alfonse and colleagues found it needed about 0.07 nanograms from a contributor, the DNA of roughly ten cells, to recover the true number reliably. Below about 0.01 nanograms of minor DNA, no method exceeded 40% accuracy. At the low template levels where these cases are actually contested, the number of contributors is frequently unknowable.
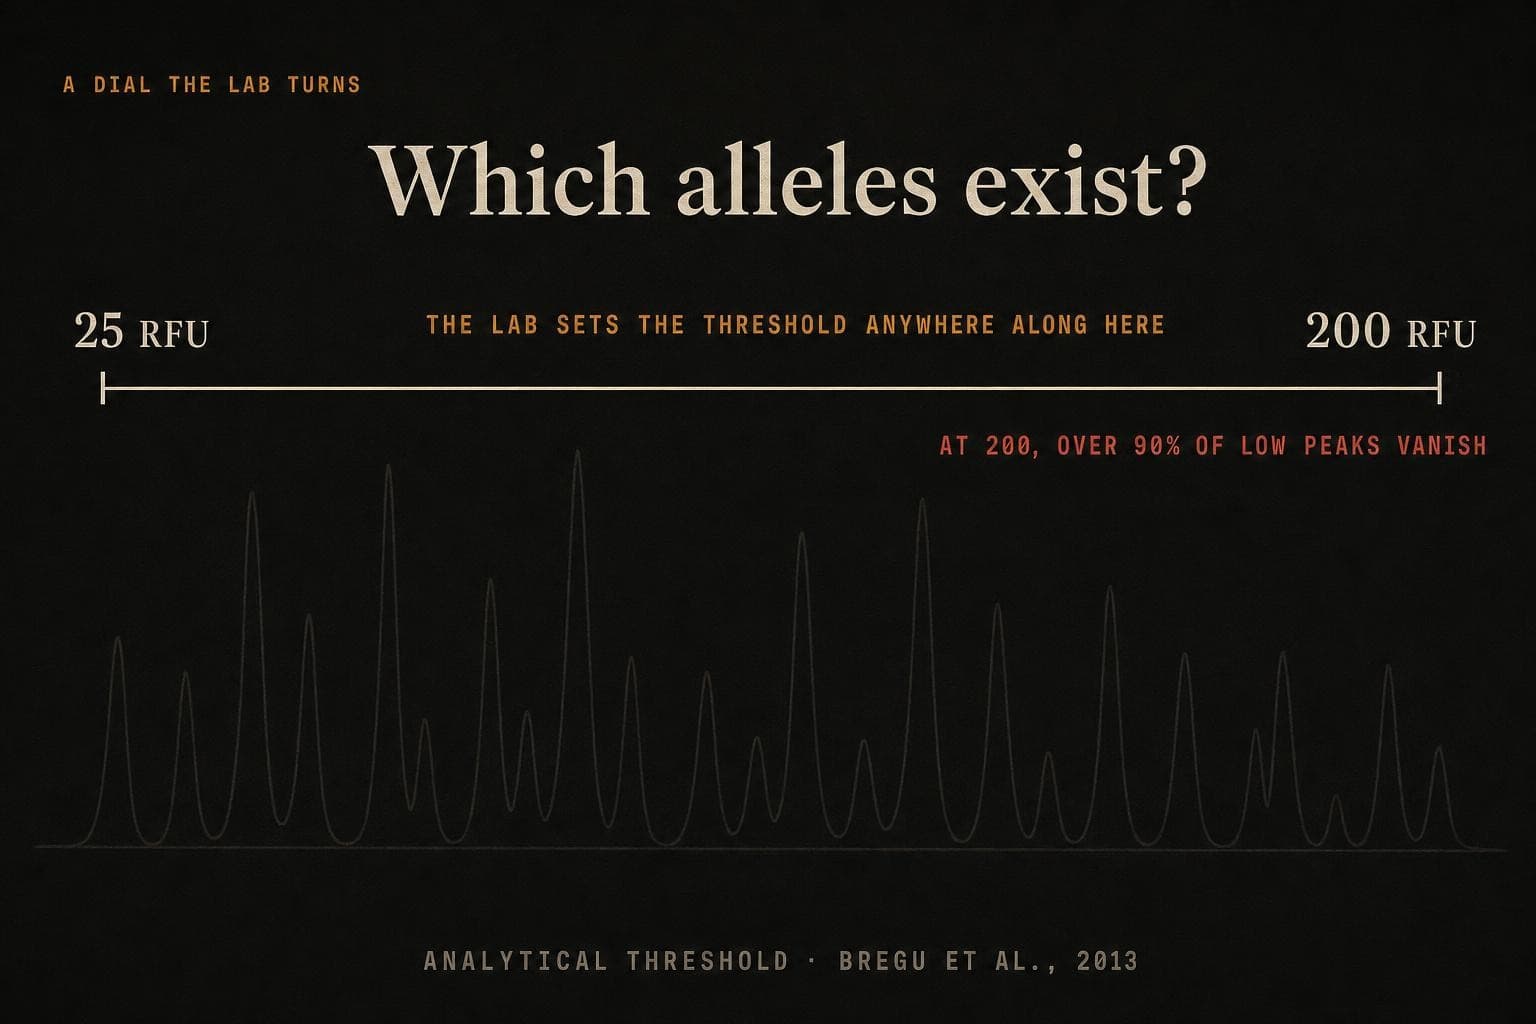
Underneath the counting sits a choice most juries never hear about. Before any peak is called a real allele, it has to clear the analytical threshold, a fluorescence cut-off measured in relative fluorescence units. That threshold is not a constant of nature. It is a value the laboratory sets, and across laboratories it ranges from roughly 25 to 200 units. Where the analyst puts it decides which alleles appear at all.
The effect is large and one-directional. Christine Rakay and colleagues measured it: raising the analytical threshold toward 200 units left more than 90% of the low peaks unlabelled and drove locus drop-out from essentially zero up past 0.8. The alleles that vanish were never absent from the sample; they were thresholded out. A profile is not simply read off the machine. It is constructed, and one of the construction tools is a dial the laboratory turns.
“ATs vary from laboratory to laboratory and can range anywhere from the very low to the extremely high (i.e., 25–200 RFU).”
None of this makes mixture interpretation worthless. A clean two-person mixture with a clear major and minor contributor and ample template is routinely and reliably resolved; the counting methods agree and the deconvolution is sound. The Association's own guidelines require each laboratory to establish and validate its thresholds precisely so the choices are documented and defensible. The honest position is narrower than the reputation. On a good two-person mixture the interpretation is strong. On a low-template, three-plus-person, high-drop-out mixture, the examiner cannot always say how many people are present, cannot be sure which peaks are real, and is working with a profile whose shape depended on a cut-off the laboratory chose.
How many people?
You reported a mixed profile and included the accused as a contributor.
"I put it to you that you cannot actually tell this jury how many people contributed to this sample; that the counting method your field uses gets the number wrong the majority of the time on complex mixtures; and that the cut-off below which a peak is simply not called was a number your own laboratory chose. Had you set it lower, alleles you are calling absent would have appeared, wouldn't they?"
Inside the black box
When a mixture is too complex to interpret by hand, laboratories now feed it to probabilistic genotyping software: STRmix, TrueAllele, EuroForMix and others. The programs build a statistical model of the mixture and return a likelihood ratio. This is genuine progress over the old subjective methods, and on validation data the leading programs perform well. But two facts about how they work matter in court, and neither is obvious from the single number on the report.
The first is that the number is not fixed. These systems sample randomly as they search, seeding from the computer's clock, so, as the STRmix developers themselves state, one should expect a degree of variation between runs of the same profile on the same data. And the answer moves with the operator's choices. Change the population-substructure value a single input, and one program's likelihood ratio shifts by more than two orders of magnitude on identical data. The figure in the report is one draw, under one set of settings, not a measurement.
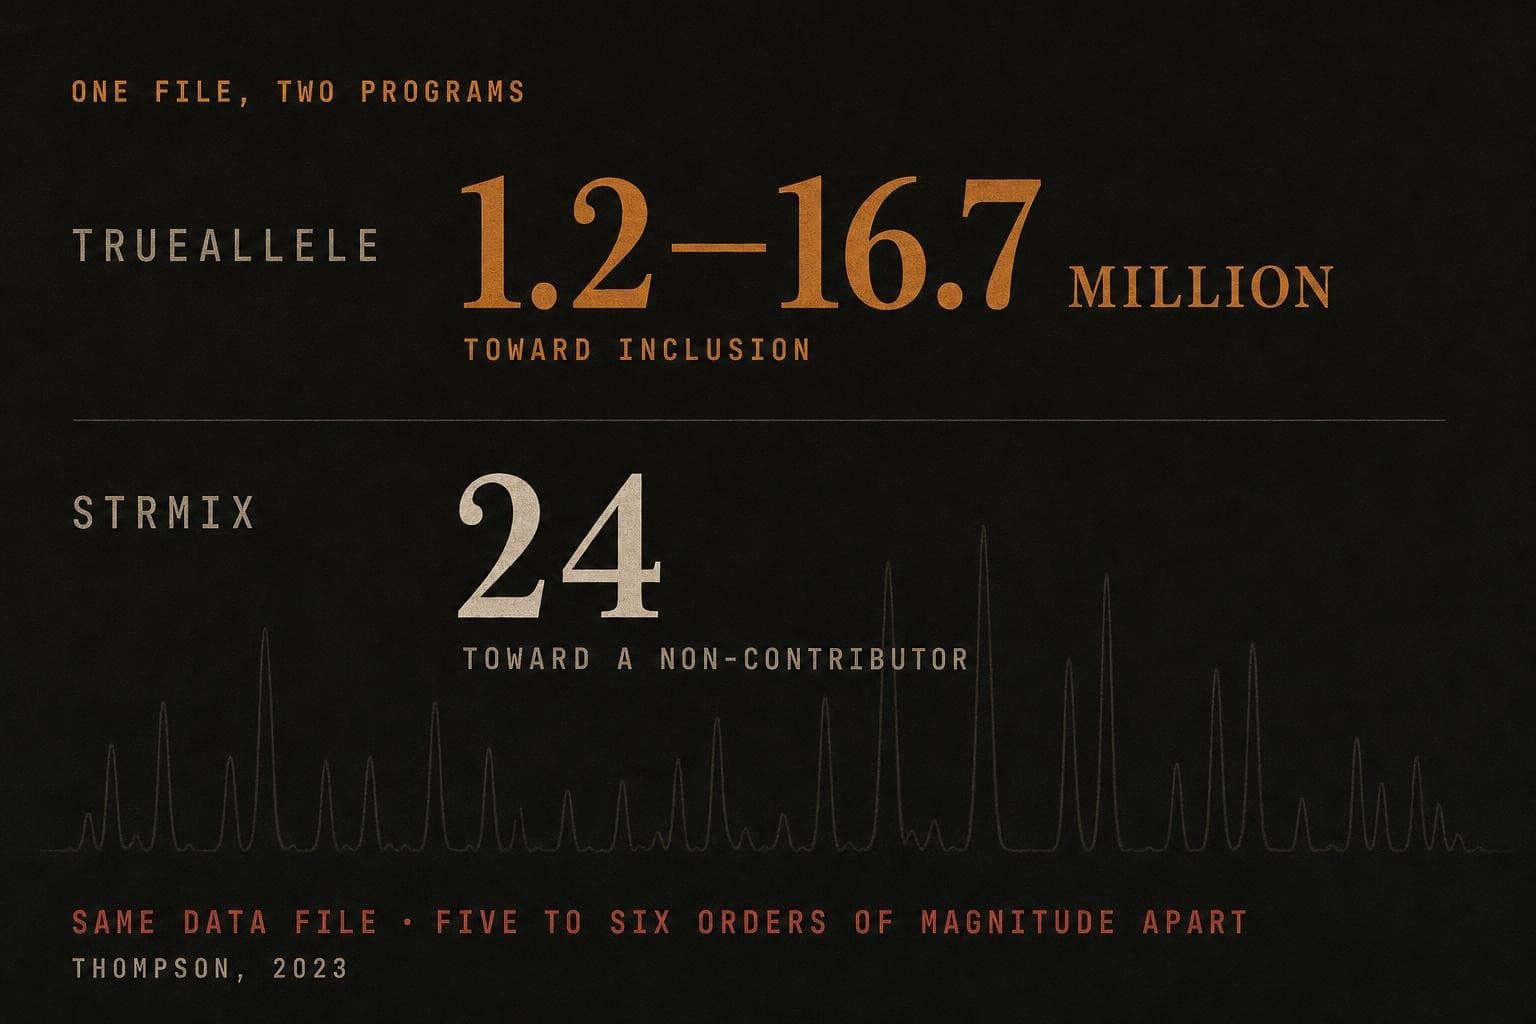
The starkest demonstration is a single evidence sample run through two accepted programs. William Thompson reconstructed such a case: on the same electronic data file, STRmix reported a likelihood ratio of 24 in favour of the non-contributor, while TrueAllele reported between 1.2 and 16.7 million the other way, a divergence of five to six orders of magnitude. The gap did not come from the DNA. It came from different estimates of the mixture ratio, different threshold choices, and an unexplained correction one program applied at two loci. Two programs, each admitted in court and each claiming high accuracy, read the same file and disagreed by close to a million-fold.
The second fact is that the software is a literal black box. The source code of the main commercial systems is withheld as a trade secret, so no independent scientist can check that the code does what the method claims. When code has been examined, undisclosed behaviour has turned up. New York's Forensic Statistical Tool was found to contain a function that silently dropped data from a locus, a function that fired on 104 of the laboratory's own 439 validation samples, 23.7%, and skewed results toward including people who were not in the sample.
“Hiding the source code is not the answer. The solution is producing it under a protective order.”
The developers' answer is not unreasonable, and the section states it fairly: reliability, they argue, is shown by extensive validation on real and simulated data, not by reading code, and the source code is a legitimate trade secret. Validation does establish that the programs work well within the conditions tested. But validation and code review answer different questions. Validation shows the program gave the right answer on the samples the makers chose; it cannot show the code correctly implements the method on the next sample, which is precisely how the Forensic Statistical Tool's hidden function survived years of validation. A New Jersey appellate court, in State v. Pickett, held that a defendant who shows a particularised need is entitled to the source code under a protective order. For most cases, no one outside the developer has ever read the code that produced the number, and the honest witness says so.
The number from the box
You relied on probabilistic-genotyping software to produce the likelihood ratio.
"I put it to you that a rival program, equally accepted in these courts, running on the very same data file, produced a number that differed from yours by a factor approaching a million; that your program does not even return the same answer twice; and that no independent scientist has ever been permitted to read the code that generated your figure. You cannot assure this court it did what it claims, can you?"
The same profile, different answers
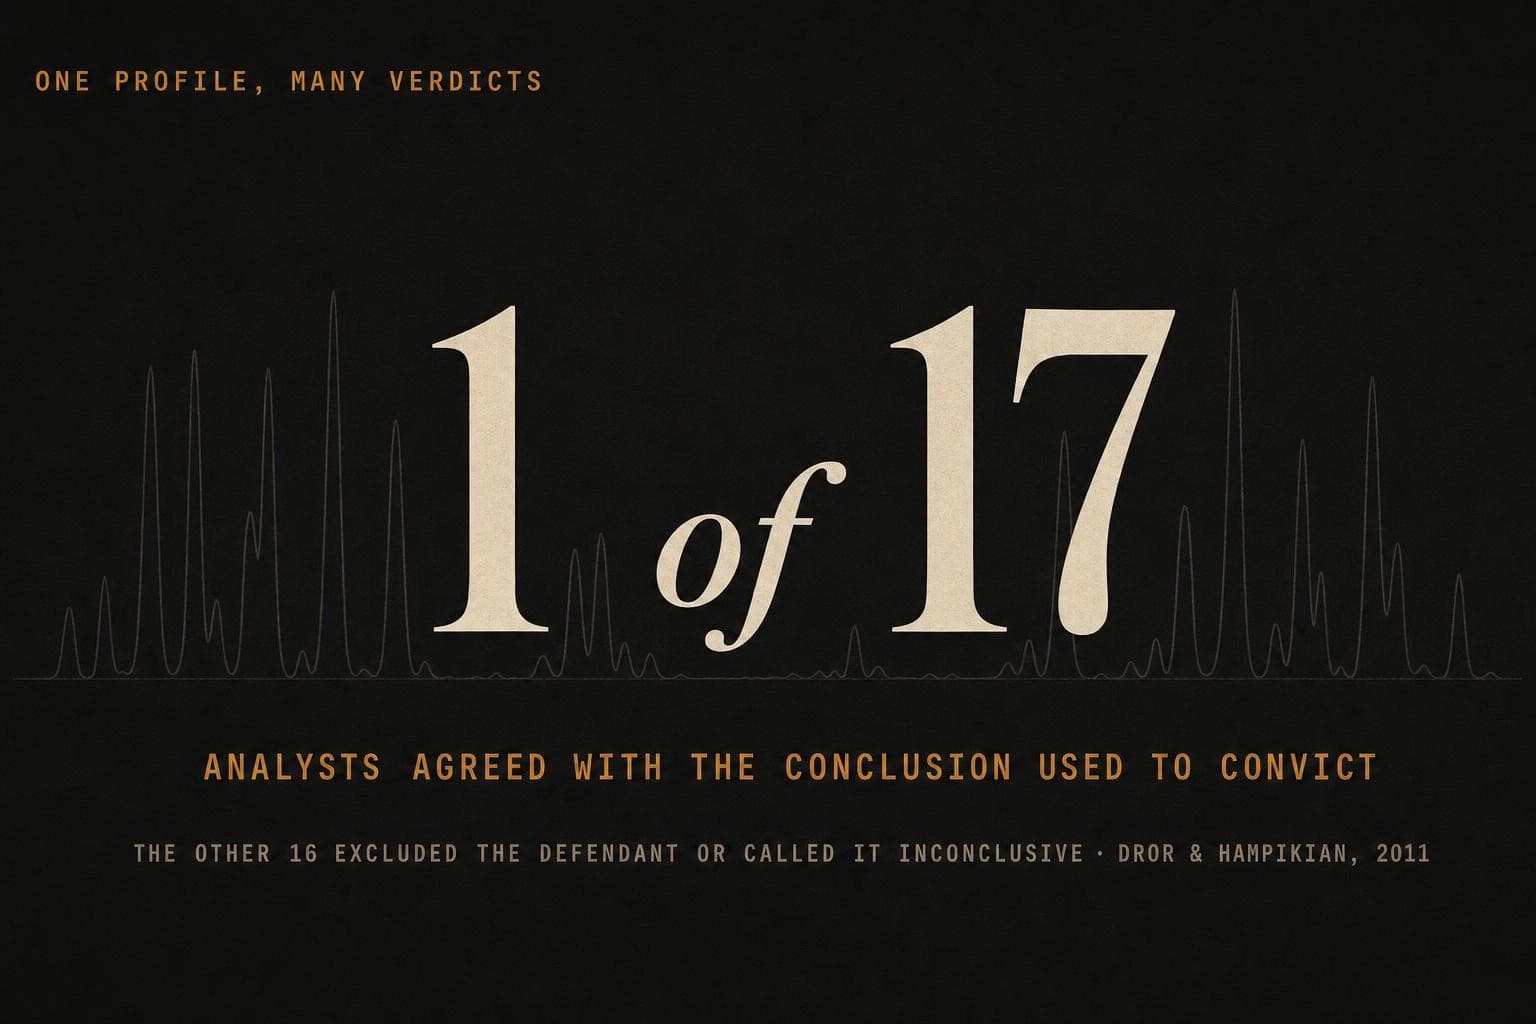
If interpretation were objective, the same profile would yield the same conclusion in any competent laboratory. It does not. Itiel Dror and Greg Hampikian took the mixture evidence from a real Georgia gang-rape case, where the original laboratory had reported the defendant could not be excluded, and sent it, with no case context, to 17 experienced analysts in an accredited laboratory. One agreed with the original conclusion. The other sixteen did not: most excluded the defendant outright, the rest called it inconclusive. Same electropherograms, same guidelines, one analyst in seventeen reaching the answer that helped convict.
That is not an isolated study. When the US National Institute of Standards and Technology sent an identical mixture to laboratories nationwide, the reported statistics for the same data spanned roughly ten orders of magnitude. In a later NIST study built around a four-person mixture designed to look like a two-person one, 74 of 108 laboratories, 69%, falsely included a person who was not in the mixture at all, and gave a statistic supporting it; only seven laboratories, 6%, correctly excluded him. More recent work by Austin Hicklin and colleagues finds that two laboratories given the same mixture agree on whether it is even suitable for comparison only about two-thirds of the time, and on low-level samples reach flatly opposite include-or-exclude calls about one time in five.
The reason interpretation can drift is that the examiner is rarely working blind. The case arrives with a suspect, a theory, and a reference profile in hand, and it is tempting to use the suspect's genotype to decide which ambiguous peaks are real. Cognitive science is unambiguous that this shapes judgement without the person feeling it, and, as a group of forensic scientists put it, contextual bias cannot be conquered by force of will, because people are not aware of the extent to which they are influenced.
“Only 1 (out of 17) gave the same conclusion as the original analysts, 16 other examiners reached a different and conflicting conclusion”
The fair counter is that the variation is not irreducible, and it concentrates on hard samples. When Lourdes Prieto and colleagues gave 18 laboratories shared software, common training and agreed propositions, the likelihood ratios converged to within less than an order of magnitude. Agreement on clean, high-template mixtures is high; the disagreement bites on low-level, high-sharing, complex ones, which is exactly the category that reaches a contested trial. The safeguard the field itself endorses is sequential unmasking: interpret and record the evidence profile before looking at the suspect's reference, so the answer cannot be steered by the target. It is a procedure a laboratory either followed or did not, and "I kept an open mind" is not the same thing.
A different laboratory
You interpreted the mixture after receiving the accused's reference profile.
"I put it to you that had this same profile gone to a different laboratory, you cannot tell this jury they would have reached your conclusion; that when this has been tested, laboratories looking at identical data have disagreed over whether a person was even included; and that you formed your view only after you had my client's reference profile in front of you, without using the recognised safeguard against it steering your judgement."
The number
The one-in-a-billion figure is the most persuasive number a jury will hear, and it rests on assumptions worth naming. The random-match probability is built by multiplying allele frequencies together, which assumes the population mates at random. It does not, so a correction for population substructure is applied, the theta or coancestry term, set at 0.01 for most populations and 0.03 for small isolated ones. The correction is deliberately conservative, made in the defendant's favour, and cross-examining it usually backfires. The number is not junk. But it answers one narrow question: how often an unrelated stranger would coincidentally share this profile.
Two things are commonly done to it that the number cannot bear. The first is the prosecutor's fallacy, transposing the conditional. "The chance this came from someone other than the accused is one in a billion" is not what the figure means; it is the chance an innocent, unrelated person would match, which is a different quantity. In R v Deen a conviction was quashed over exactly this slip. The second is the database hit. When a profile is found by trawling a database of millions rather than by testing a named suspect, the relevant statistic changes, and matches become expected: a nine-locus match was found in a database of 65,000 profiles where the chance of some matching pair was about 94%, precisely as the birthday problem predicts.
The decisive practical point is the one most often left out. The random-match probability is the chance of a coincidental match. It is not the chance of a false match, because a false match can also come from a laboratory error, a swap, a mislabelling, a contamination event, and those happen far more often than one in a billion. Jonathan Koehler put it plainly: in most cases the possibility of laboratory error is substantially larger than the possibility of a coincidental match, not because the work is sloppy but because the coincidence is so remote. When the error rate is one in a few hundred and the random-match probability is one in a billion, the true chance of a false match is governed by the error rate, and the billion is almost irrelevant.
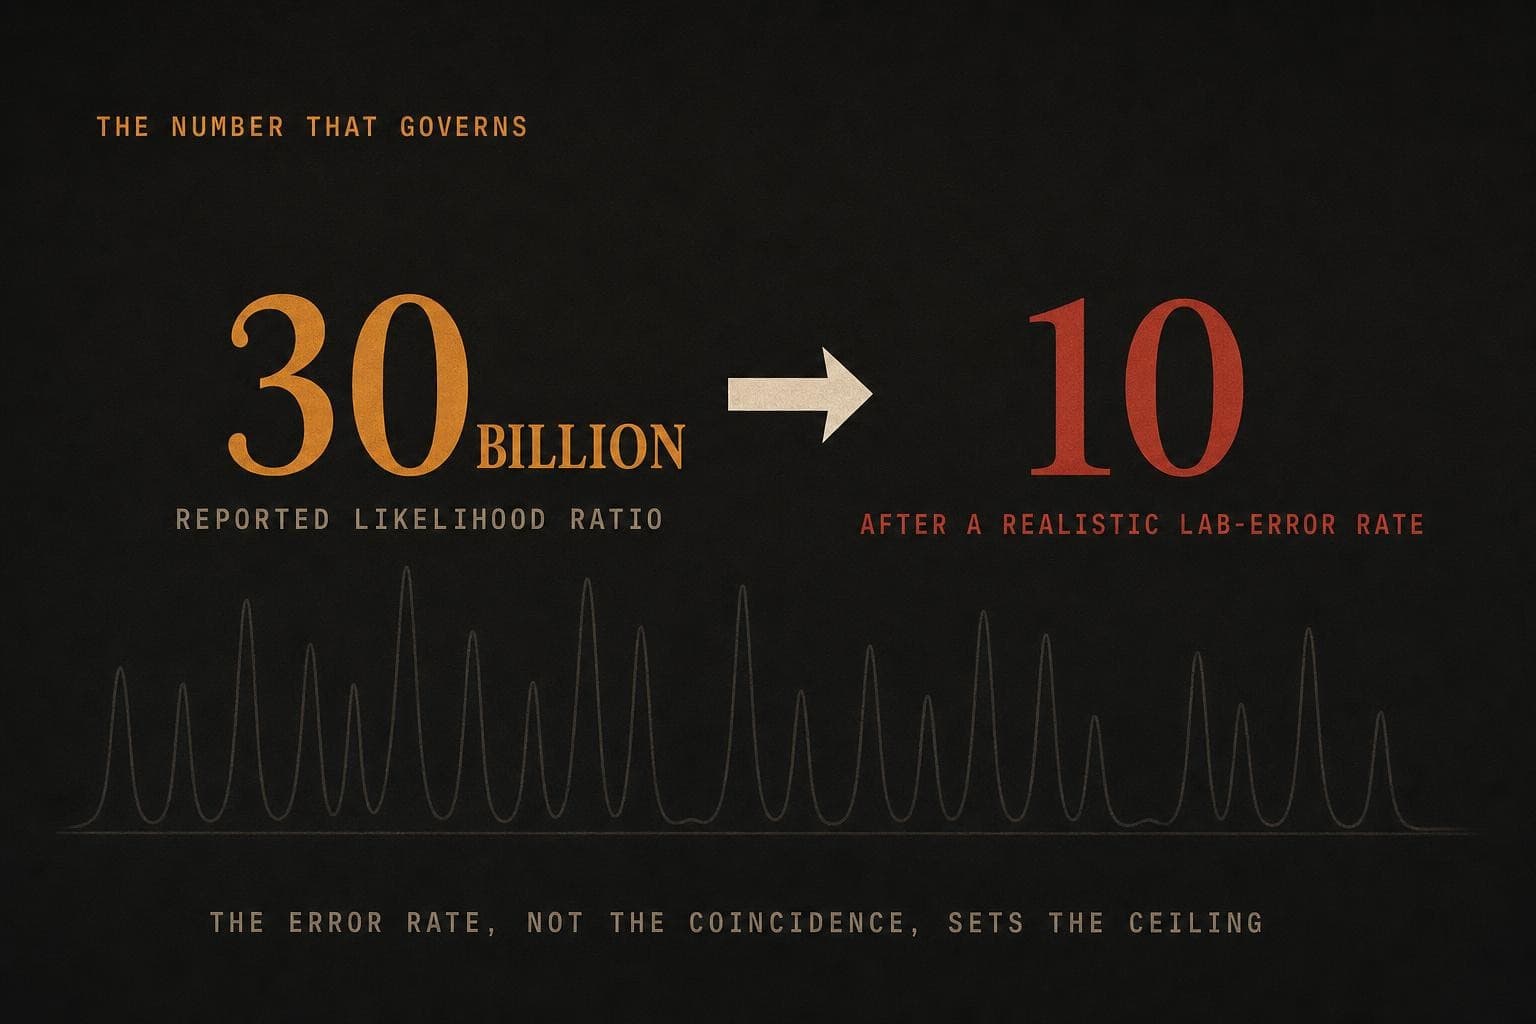
The arithmetic is stark. William Thompson worked a case where a reported likelihood ratio of 30 billion fell to about ten once a realistic probability of laboratory error was included. An accurate estimate of the error rate, he concluded, matters far more than an accurate estimate of the profile frequency, because the error rate sets the ceiling and the frequency sits far below it.
“In most cases, the possibility of laboratory error is substantially larger than the possibility of a coincidental match.”
The fair statement holds both halves. For a good single-source profile the random-match probability genuinely is astronomically small, the theta corrections are conservative rather than defence-friendly, and a well-run laboratory has a low measured error rate. The error-rate argument does not nullify a clean result; it bounds its weight. But the bound matters, because the number the jury remembers is the billion, and the number that actually governs the chance of a false match is the one the report usually omits. The honest witness gives the match probability for what it is, the coincidence figure, and concedes that the probability of a laboratory or handling error, which is larger and rarely quoted, is the one that limits how far the evidence can be trusted.
The number that governs
You gave the jury a random-match probability of one in a billion.
"I put it to you that your one-in-a-billion figure is only the chance that an unrelated stranger would coincidentally share this profile; that it says nothing about the far larger chance that this sample was swapped, mislabelled or contaminated in your laboratory before it reached the machine; and that it is that larger chance, not your billion, which governs whether this is truly my client's DNA."
How did it get there?
A match tells you whose DNA it is. It does not tell you how or when the DNA arrived, and DNA moves. It transfers from person to person, from person to object, and onward again, and it can end up on someone or something with no direct contact at all. Georgina Meakin and Allan Jamieson, reviewing the transfer literature, reach the conclusion the whole section turns on: neither the quantity of DNA recovered nor the quality of the profile can tell you the mechanism by which it was deposited. A strong, clean profile does not mean a hand was there.
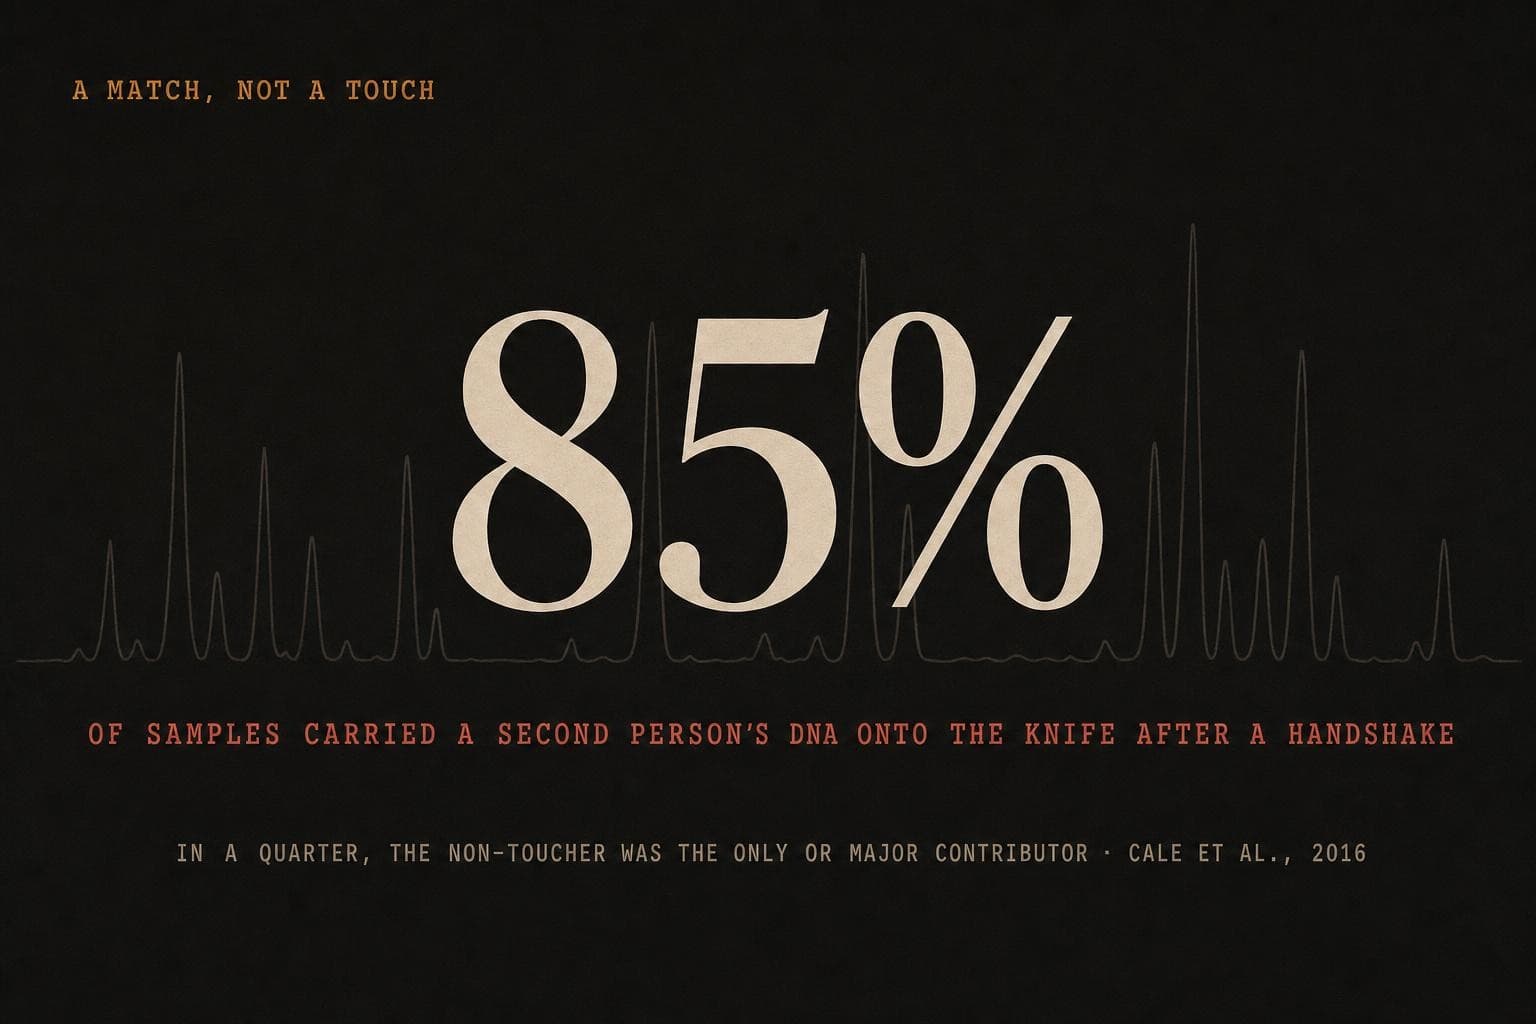
The experiments are vivid. In Cynthia Cale's study, pairs shook hands for two minutes and then each handled a knife; in 85% of samples the other person's DNA transferred to the knife, and in a quarter of them the person who had never touched the knife was the only or the major contributor on it. A full, single-source, astronomically discriminating profile on a weapon can belong to someone who never held it.
Transfer does not need contact, and it does not stop at one step. Shaking out a worn shirt, a towel or a pillowcase deposited a person's DNA on a clean surface in 26 of 30 trials, often as the sole or major profile. In investigator-mediated chains, DNA carried on a glove reached a third surface as a full, reportable, database-searchable profile, and in one chain a person's partner's DNA, someone who had never been near the office, appeared across every surface. Twenty minutes sharing a jug of drink seeded people's DNA onto objects they never touched in a third of samples. And the strongest contributor is not necessarily the last person to touch an item: in one study the person who made a handprint was excluded from their own print about one time in six, while a non-toucher was included.
“the secondary contributor was either the only contributor or the major contributor identified despite never coming into direct contact with the knife”
This is not an argument that a match proves nothing. It is an argument that whose and how are separate questions, and the second one has to be worked, not assumed. The field has a formal framework for it: transfer, persistence, prevalence and recovery, evaluated against activity-level propositions, the subject of the International Society for Forensic Genetics guidance. With proper background and transfer data and paired propositions, a large quantity of fresh cellular material and a plausible contact can support a strong direct-transfer inference. What is not defensible is to report an overwhelming match and let the jury supply the act. The honest witness states whose DNA it is, concedes that the profile alone cannot say how or when it was deposited, and says whether any activity-level analysis was actually done.
It could arrive without him
You told the jury the accused's DNA on the weapon shows he handled it.
"I put it to you that my client's DNA could have reached that knife without him ever touching it, carried there on the hand of the person who did, or on an officer's glove, or shaken loose from a towel in the same room; and that from the profile alone you cannot tell this jury whether it was left on the night in question or transferred there earlier. You did no analysis to rule that out, did you?"
Contamination, error, and the cases that got it wrong
The clearest puncture of the infallibility reputation is the record of cases where DNA got it wrong. Contamination is not an exotic mishap; it is, as Norah Rudin and colleagues write, inherent in modern sensitive DNA analysis, something that can be detected and minimised but not eliminated. The measured rates are real. An Austrian audit found police contamination in about 0.75% of crime-scene samples, rising to 1.33% as detection improved, with almost one in ten officers having contaminated evidence at least once, and the authors estimating the true rate at 1.5 to 2%. The Netherlands Forensic Institute, one of the few laboratories that publishes its numbers, logged three false matches reaching reports in five years.
And there is a phrase worth dismantling. When a report says no contamination was associated with a case, that does not mean none occurred; it means nothing unexpected was seen. A contaminant that happens to match the suspect looks exactly like a genuine result. A clean negative control does not prove the evidence sample was uncontaminated either; it shows the reagents were clean, and contamination at the scene or on the bench sails straight past it, which was the error at the heart of the Amanda Knox case.
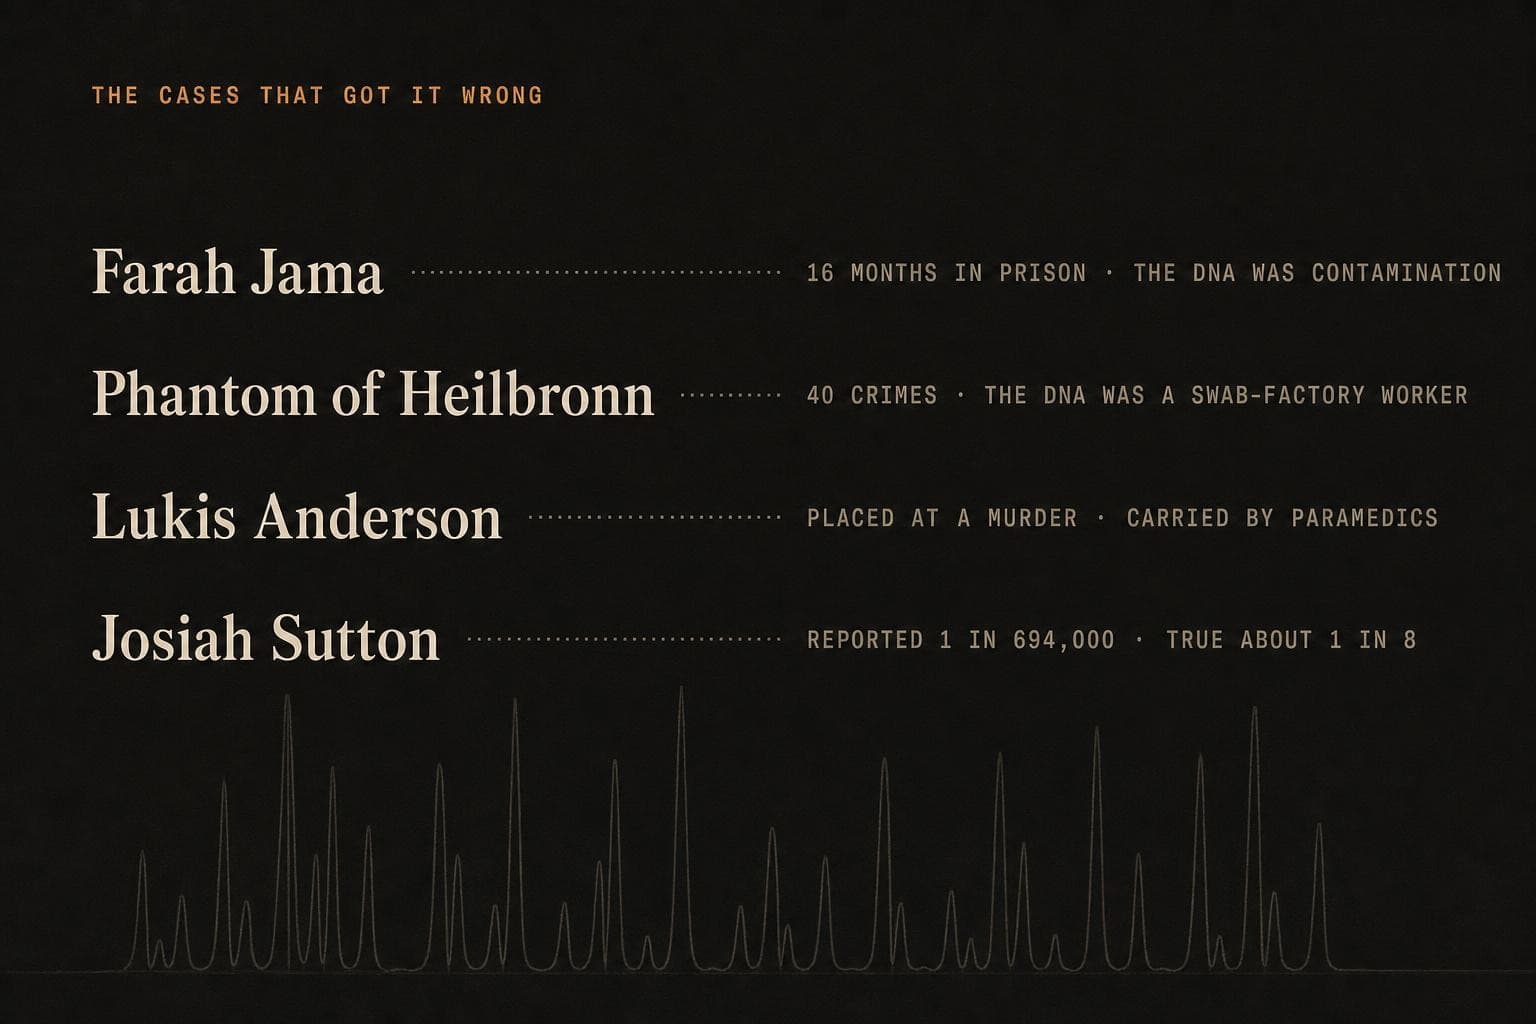
The cases make it concrete. In Victoria, Farah Jama was convicted of rape and imprisoned for sixteen months on a single piece of evidence, a DNA sample that turned out to be contamination, transferred from a woman the same doctor had examined in the same unit a day earlier; the crime, the inquiry found, had almost certainly never happened. In Germany, the Phantom of Heilbronn, a woman whose DNA linked forty crimes including a police officer's murder, was a worker at the cotton-swab factory. In California, Lukis Anderson's DNA was found under a murder victim's fingernails while he lay in a hospital, transferred by the paramedics who had treated them both. Josiah Sutton served four and a half years after a Houston laboratory reported a mixture statistic of one in 694,000 when the honest figure was about one in eight.
“the DNA evidence appears to have been viewed as possessing an almost mystical infallibility that enabled its surroundings to be disregarded”
The low-template end has its own cautionary case. In the Omagh bombing trial, R v Hoey, the judge rejected low copy number DNA because it had not been validated by the wider scientific community and, worse, because the laboratory's own method proved unreproducible on the very case: a third test overturned the consensus of the first two. The fair counter is that these failures drove reform rather than abandonment. Controls, elimination databases and accreditation catch most contamination before a report issues; the review that followed Hoey concluded the underlying science was sound; the exoneration statistics are selected for exonerations and understate nothing so much as the routine cases that go right. Both things are true. A mature quality system catches most errors, and contamination is inherent, not always caught, and has convicted innocent people. The honest witness does not claim the process is error-free, and does not let a clean control stand in for proof that this sample was clean.
It cannot be ruled out
You told the jury there was no contamination in this case.
"I put it to you that when your report says no contamination was associated with this case, that does not mean none occurred, it means nothing unexpected was seen; that a contaminant that happened to match my client would look identical to a genuine result; and that in this country an innocent man spent sixteen months in prison for a rape that never happened, convicted on a single DNA sample that was laboratory contamination. You cannot exclude that here, can you?"
Saying it like evidence
How a DNA result is worded decides how a jury weighs it, and the recurring failures have names. Jonathan Koehler catalogued them from the trial record: the source-probability error, treating the match frequency as the chance the defendant is not the source; the ultimate-issue error, treating it as the chance he is not guilty; and the impossibility claim, that a false positive cannot happen. Tellingly, these slips are committed by defence and prosecution alike, which tells you they are driven by misunderstanding, not advocacy. Underneath sits the fact that a reported match is not certainly a true match: false positives run at roughly one to four per cent of match reports in open proficiency tests.
The misunderstanding does not stop at the lawyers. When William Thompson and Eryn Newman tested jury-eligible adults, nearly two-thirds endorsed a source-probability-error reading of the evidence as correct, while rating their own understanding highly. No presentation format was clean, and the likelihood-ratio wording was the most misread of all. And the choice of words can flip the signal: hand the same mixed profile to nineteen qualified experts and, depending only on how each wrote it up, the same trace was rated incriminating by one and strongly exculpatory by another.
There is a correct form, and it is not complicated. The evaluative-reporting standards are explicit: the scientist reports the probability of the findings given the competing propositions, the likelihood ratio for the evidence, and not the probability of the propositions themselves. The likelihood ratio says nothing about propositions other than the two considered, and both could be false. Guilt is the court's to weigh against everything else. The witness who says the DNA is a hundred thousand times more likely if it came from the defendant than from an unrelated person, and stops there, has said exactly what the evidence supports. The witness who says the DNA proves it was the defendant has said something the number cannot carry.
“The role of the forensic practitioner is to consider the probability of the findings given the propositions that are addressed, and not the probability of the propositions.”
DNA conclusions fail most often in the wording. Each phrase below overstates what a match can support; the alternative keeps the sentence inside the likelihood ratio for the evidence, and leaves guilt to the court.
The through-line of the whole reading is a single distinction the witness has to hold: the difference between a strong sub-source match and everything the courtroom wants to read into it. DNA earns its reputation at the bottom of the hierarchy, on a good single-source profile, where the coincidence probability is genuinely tiny. It loses that footing rung by rung, and the sections here are the rungs: the mixture whose contributors cannot be counted, the software whose number will not repeat, the profile two laboratories read differently, the error rate that dwarfs the match probability, the DNA that arrived by transfer, the contaminant that matched by chance. The examiner who states what the match supports, under stated propositions, with the error rate acknowledged, and who declines to convert it into an account of the act, is on ground the evidence can hold. Beyond that, the reputation is doing the work, not the science.
- 01A match is a sub-source statement: whose DNA it is, not how or when it got there, or who is guilty. The likelihood ratio at activity level can be far smaller, even close to one, than the sub-source figure.
- 02On a low-template or complex mixture you often cannot say how many people contributed, and the analytical threshold that decides which alleles appear is a value the laboratory chose (25–200 RFU), not a constant.
- 03Probabilistic-genotyping software does not return the same answer twice, moves with operator-set parameters, has given million-fold-different results across two accepted programs on one sample, and runs on source code no independent scientist has read.
- 04The same profile yields different conclusions across analysts and laboratories: one in seventeen agreed in the Dror study, and 74 of 108 labs falsely included a non-contributor on identical data. Sequential unmasking is the safeguard; willpower is not.
- 05The random-match probability is a coincidence figure. It ignores laboratory error, which is typically far larger and governs the true chance of a false match. Do not transpose the conditional, and treat a database-trawl hit as the different statistic it is.
- 06A match cannot say how or when the DNA arrived. DNA transfers secondarily and without contact, and a non-contributor can be the only contributor on an object. Say whether any activity-level analysis was actually done.
- 07Contamination is inherent and not always detected; "no contamination associated" means only that nothing unexpected was seen, and a negative control catches only reagent contamination. Innocent people have been convicted on contaminated DNA.
- 08Report the likelihood ratio for the evidence under stated competing propositions, not the probability of guilt. "The DNA proves it was the defendant" says what the number cannot carry.
Say it like evidence
You told the jury the DNA "matches" the accused.
"I put it to you that telling this jury the DNA 'matches' my client invites them to hear that it proves he did it, and your figure, which is a frequency in a population, cannot support that step; that if the very same profile could honestly be written up by another analyst as pointing away from him, what this jury is weighing is your choice of words, not a fixed fact of the DNA."
Still have questions about the research?
Ask anything about the forensic DNA interpretation literature. The tutor answers from the document itself — and keeps one eye on how it might come up under cross-examination.
- Evett, I. W., Gill, P. D., Jackson, G., Whitaker, J., & Champod, C. (2002). Interpreting small quantities of DNA: the hierarchy of propositions and the use of Bayesian networks. Journal of Forensic Sciences, 47(3), 520–530.
- Gill, P., Hicks, T., Butler, J. M., et al. (2018). DNA commission of the International Society for Forensic Genetics: Assessing the value of forensic biological evidence — Guidelines highlighting the importance of propositions. Part I: evaluation of DNA profiling comparisons given (sub-)source propositions. Forensic Science International: Genetics, 36, 189–202.
- Gill, P., Hicks, T., Butler, J. M., et al. (2020). DNA commission of the International Society for Forensic Genetics: Assessing the value of forensic biological evidence — Part II: Evaluation of biological traces considering activity level propositions. Forensic Science International: Genetics, 44, 102186.
- Jackson, G., & Biedermann, A. (2019). "Source" or "activity": What is the level of issue in a criminal trial? Significance, 16(2), 36–39.
- Budowle, B., Eisenberg, A. J., & van Daal, A. (2009). Validity of low copy number typing and applications to forensic science. Croatian Medical Journal, 50(3), 207–217.
- Balding, D. J., & Buckleton, J. (2009). Interpreting low template DNA profiles. Forensic Science International: Genetics, 4(1), 1–10.
- Haned, H., Pène, L., Lobry, J. R., Dufour, A. B., & Pontier, D. (2011). Estimating the number of contributors to forensic DNA mixtures: Does maximum likelihood perform better than maximum allele count? Journal of Forensic Sciences, 56(1), 23–28.
- Alfonse, L. E., Tejada, G., Swaminathan, H., Lun, D. S., & Grgicak, C. M. (2017). Inferring the number of contributors to complex DNA mixtures using three methods. Journal of Forensic Sciences, 62(2), 308–316.
- Rakay, C. A., Bregu, J., & Grgicak, C. M. (2012). Maximizing allele detection: Effects of analytical threshold and DNA levels on rates of allele and locus drop-out. Forensic Science International: Genetics, 6(6), 723–728.
- Bregu, J., Conklin, D., Coronado, E., Terrill, M., Cotton, R. W., & Grgicak, C. M. (2013). Analytical thresholds and sensitivity: Establishing RFU thresholds for forensic DNA analysis. Journal of Forensic Sciences, 58(1), 120–129.
- Thompson, W. C. (2023). Uncertainty in probabilistic genotyping of low template DNA: A case study comparing STRmix™ and TrueAllele™. Journal of Forensic Sciences, 68(3), 1049–1063.
- Coble, M. D., & Bright, J.-A. (2019). Probabilistic genotyping software: An overview. Forensic Science International: Genetics, 38, 219–224.
- Buckleton, J. S., Bright, J.-A., Gittelson, S., et al. (2019). The probabilistic genotyping software STRmix: Utility and evidence for its validity. Journal of Forensic Sciences, 64(2), 393–405.
- Adams, N., Koppl, R., Krane, D., Thompson, W., & Zabell, S. (2018). Letter to the Editor — Appropriate standards for verification and validation of probabilistic genotyping systems. Journal of Forensic Sciences, 63(1), 339–340.
- Matthews, J., Babaeianjelodar, M., Lorenz, S., et al. (2019). The right to confront your accusers: Opening the black box of forensic DNA software. Proceedings of the 2019 AAAI/ACM Conference on AI, Ethics, and Society, 321–327.
- Imwinkelried, E. J. (2016). Computer source code: A source of the growing controversy over the reliability of automated forensic techniques. DePaul Law Review, 66, 97–131.
- State v. Pickett, 246 A.3d 279 (N.J. Super. Ct. App. Div. 2021).
- Dror, I. E., & Hampikian, G. (2011). Subjectivity and bias in forensic DNA mixture interpretation. Science & Justice, 51(4), 204–208.
- Butler, J. M., Kline, M. C., & Coble, M. D. (2018). NIST interlaboratory studies involving DNA mixtures (MIX05 and MIX13): Variation observed and lessons learned. Forensic Science International: Genetics, 37, 81–94.
- Hicklin, R. A., Richetelli, N., Emerick, B. L., Bever, R. A., & Davoren, J. M. (2023). Variation in assessments of suitability and number of contributors for DNA mixtures. Forensic Science International: Genetics, 66, 102892.
- Krane, D. E., Ford, S., Gilder, J. R., et al. (2008). Sequential unmasking: A means of minimizing observer effects in forensic DNA interpretation. Journal of Forensic Sciences, 53(4), 1006–1007.
- Prieto, L., Haned, H., Mosquera, A., et al. (2014). Euroforgen-NoE collaborative exercise on LRmix to demonstrate standardization of the interpretation of complex DNA profiles. Forensic Science International: Genetics, 9, 47–54.
- Nichols, R. A., & Balding, D. J. (1991). Effects of population structure on DNA fingerprint analysis in forensic science. Heredity, 66(2), 297–302.
- Balding, D. J., & Donnelly, P. (1994). The prosecutor's fallacy and DNA evidence. Criminal Law Review, 1994(Oct), 711–721.
- Weir, B. S. (2007). The rarity of DNA profiles. Annals of Applied Statistics, 1(2), 358–370.
- Koehler, J. J. (1996). On conveying the probative value of DNA evidence: Frequencies, likelihood ratios, and error rates. University of Colorado Law Review, 67, 859–886.
- Koehler, J. J. (1993). Error and exaggeration in the presentation of DNA evidence at trial. Jurimetrics Journal, 34(1), 21–39.
- Meakin, G. E., & Jamieson, A. (2013). DNA transfer: review and implications for casework. Forensic Science International: Genetics, 7(4), 434–443.
- Cale, C. M., Earll, M. E., Latham, K. E., & Bush, G. L. (2016). Could secondary DNA transfer falsely place someone at the scene of a crime? Journal of Forensic Sciences, 61(1), 196–203.
- van Oorschot, R. A. H., Szkuta, B., Meakin, G. E., Kokshoorn, B., & Goray, M. (2019/2021). DNA transfer in forensic science: A review / recent progress towards meeting challenges. Forensic Science International: Genetics, and Genes, 12, 1766.
- Thornbury, D., Goray, M., & van Oorschot, R. A. H. (2021). Transfer of DNA without contact from used clothing, pillowcases and towels by shaking agitation. Science & Justice, 61(6), 797–805.
- Kloosterman, A., Sjerps, M., & Quak, A. (2014). Error rates in forensic DNA analysis: Definition, numbers, impact and communication. Forensic Science International: Genetics, 12, 77–85.
- Pickrahn, I., Kreindl, G., Müller, E., et al. (2017). Contamination incidents in the pre-analytical phase of forensic DNA analysis in Austria — Statistics of 17 years. Forensic Science International: Genetics, 31, 12–18.
- Rudin, N., Inman, K., & Noureddine, M. (2025). Letter to the Editor — Documentation, investigation, and disclosure of contamination events. Journal of Forensic Sciences, 70(2), 815–819.
- Gill, P. (2016). Analysis and implications of the miscarriages of justice of Amanda Knox and Raffaele Sollecito. Forensic Science International: Genetics, 23, 9–18.
- Thompson, W. C. (2003). Review of DNA evidence in State of Texas v. Josiah Sutton. Council for Responsible Genetics / expert report.
- Thompson, W. C., & Newman, E. J. (2015). Lay understanding of forensic statistics: Evaluation of random match probabilities, likelihood ratios, and verbal equivalents. Law and Human Behavior, 39(4), 332–349.
- de Keijser, J. W., Malsch, M., Luining, E. T., Weulen Kranenbarg, M., & Lenssen, D. J. H. M. (2016). Differential reporting of mixed DNA profiles and its impact on jurists' evaluation of evidence. Forensic Science International: Genetics, 23, 71–82.
- National Research Council. (1996). The evaluation of forensic DNA evidence. National Academies Press.
- Vincent, F. H. R. (2010). Inquiry into the circumstances that led to the conviction of Mr Farah Abdulkadir Jama. Victorian Government Printer.
- R v Hoey [2007] NICC 49 (Crown Court, Northern Ireland; Weir J).
- President's Council of Advisors on Science and Technology (PCAST). (2016). Forensic science in criminal courts: Ensuring scientific validity of feature-comparison methods.
- ENFSI. (2015). Guideline for evaluative reporting in forensic science. European Network of Forensic Science Institutes.
Crime Scene Reconstruction: From Traces to Events
Counsel is briefed on this literature. Take it into the witness box and practise dNA evidence.